Initiatives Addressing Environmental Issues
Environmental Policy
In terms of environmental issues, we are contributing to the prevention of global warming by promoting the reduction of CO2 emissions through measures such as improving our operations to reduce energy consumption and introducing energy-saving equipment. Furthermore, with the objective of reducing our environmental load, we are aiming to support the realization of a circular economy with a smaller environmental footprint by conserving water, implementing the 3Rs (reducing, reusing, and recycling resources), etc.
Environmental Targets
Scope 1 and Scope 2 GHG Emissions
(1) Medium- to long-term targetFor areas that they are responsible for managing, TLR and the Asset Manager have set a medium- to long-term target of reducing energy consumption (crude oil equivalent) and greenhouse gas emission intensity by an average of at least 1% per year each.
(2) Short-term targetThe short-term target is to reduce energy consumption (crude oil equivalent) and greenhouse gas emission intensity by at least 1% year-on-year each.
Water ConsumptionThe target is to reduce specific water consumption each year compared with the previous year across the entire portfolio and at individual properties.
Waste DisposalThe target is to improve the proportion of waste that is recycled each year compared with the previous year across the entire portfolio and at individual properties. For non-residential properties, we are currently striving to improve the measurement coverage rate and to promote the 3Rs and reduce waste quantities while asking tenants to support TLR's approach as part of efforts to enhance tenant relations. At residential properties, since we cannot measure waste amounts, we will continue to conduct awareness activities aimed at tenants.
Environment-Related Data
Energy Consumption
This table can be scrolled sideways.
| Item | Overall | ||||
|---|---|---|---|---|---|
| FY2019 | FY2020 | FY2021 | FY2022 | FY2023 | |
| Total energy consumption (000s of kWh) | 23,263 | 20,996 | 26,143 | 24,478 | 20,320 |
| Fuel consumption (000s of kWh) | 7,444 | 6,421 | 5,616 | 5,173 | 2,311 |
| Electricity consumption (000s of kWh) | 15,820 | 14,575 | 20,527 | 19,305 | 18,009 |
| Renewable energy production (000s of kWh) | 325 | 354 | 351 | 367 | 348 |
| Specific energy consumption (kWh/m2)* | 146 | 133 | 124 | 112 | 80 |
| Year-on-year specific energy consumption reduction rate (%) | - | 91.2% | 93.3% | 90.3% | 71.5% |
N.B.:The intensity for * is rounded off after the decimal point.
Greenhouse Gas Emissions
This table can be scrolled sideways.
| Item | Overall | ||||
|---|---|---|---|---|---|
| FY2019 | FY2020 | FY2021 | FY2022 | FY2023 | |
| Total CO2 emissions (t-CO2) | 8,850 | 7,308 | 10,309 | 9,697 | 8,143 |
| Scope 1 emissions (t-CO2) | 1,341 | 1,169 | 1,024 | 929 | 415 |
| Scope 2 emissions (t-CO2) | 7,509 | 6,139 | 9,285 | 8,769 | 7,728 |
| CO2 emission intensity (kg-CO2/m2)* | 55 | 46 | 49 | 44 | 32 |
| Year-on-year CO2 emission intensity reduction rate (%) | - | 83.5% | 105.7% | 90.7% | 72.2% |
N.B.:The emission intensity for * is rounded off after the decimal point.
Water Consumption
This table can be scrolled sideways.
| Item | Overall | ||||
|---|---|---|---|---|---|
| FY2019 | FY2020 | FY2021 | FY2022 | FY2023 | |
| Total water consumption (thousands of m3): A+B | 134.8 | 110.7 | 180.3 | 186.8 | 179.2 |
| Externally purchased water consumption (thousands of m3): A | 132.4 | 108.6 | 177.6 | 183.6 | 175.8 |
| Other water consumption (thousands of m3): B | 2.4 | 2.1 | 2.7 | 3.2 | 3.4 |
| Specific water consumption (m3/m2): for A* | 0.83 | 0.69 | 0.84 | 0.84 | 0.69 |
| Year-on-year specific water consumption reduction rate (%) | - | 82.9% | 122.5% | 99.7% | 82.2% |
N.B.:The intensity for * is rounded off after the second decimal point.
Waste Generation
This table can be scrolled sideways.
| Item | Overall | ||||
|---|---|---|---|---|---|
| FY2019 | FY2020 | FY2021 | FY2022 | FY2023 | |
| Total waste generation (t) | 936.10 | 1,108.90 | 1,358.09 | 948.89 | 607.58 |
| Total general waste generation (t) | 936.10 | 1,108.90 | 1,358.09 | 948.89 | 607.58 |
| Total industrial waste generation (t) | 0.00 | 0.00 | 0.00 | 0.00 | 0.00 |
| Ratio by waste disposal method | |||||
| Recycling (%) | 41.4 | 39.5 | 33.6 | 27.3 | 20.3 |
| Reused (%) | 0.7 | 0.5 | 0.4 | 0.4 | 0.7 |
| Thermal recycling (%) | 11.9 | 17.3 | 0.1 | 0.1 | 0.0 |
| Incinerated (%) | 26.2 | 24.6 | 33.0 | 39.3 | 27.2 |
| Landfill (%) | 5.8 | 8.6 | 7.9 | 0.6 | 0.9 |
| Unknown (%) | 14.0 | 9.5 | 25.1 | 32.4 | 50.9 |
N.B.:The intensity for * is rounded off after the decimal point.
Basis for Calculating Environmental Performance
This table can be scrolled sideways.
| Item | Energy Consumption | Greenhouse Gas Emissions | Water Consumption | Waste Generation |
|---|---|---|---|---|
| Reporting scope |
|
|||
| Aggregation period |
|
|||
| Intensity denominator |
|
|||
| Premises of calculation method |
|
|
|
- |
| Intensity calculation method |
\[ \sf Intensity = \frac{Energy\ consumption\ amount\ or\ greenhouse\ gas\ emission\ amount\ or\ water\ consumption\ amount}{Total\ floor\ area*} \] *The total floor area here is the sum of the total floor areas based on the calculation method indicated in “Intensity denominator”. |
- | ||
Initiatives Addressing Environmental Issues at Assets under Management
The Asset Manager is engaged in energy-saving upgrades and improvements to building operations for the purpose of reducing the portfolio's environmental footprint and improving the interior environment.
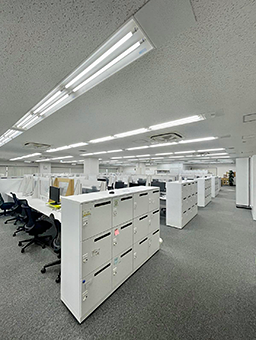
Energy-Saving and LED Conversion Work
Conversion to LED lighting is progressing at 60 properties (including partial conversion) in the portfolio. The LED conversion rate for the portfolio is as shown below (based on floor area; as of the end of Auguest 2025).
This table can be scrolled sideways.
| No. of Properties (including partial implementation) |
LED Conversion Rate across Portfolio | ||
|---|---|---|---|
| LED conversion work | 60 | Total: 75.3% | In common areas: 90.1% |
| In private areas: 67.0% | |||
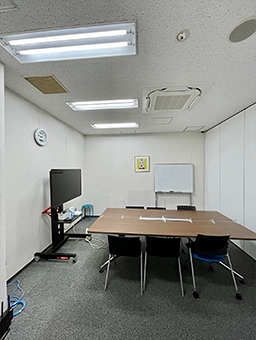
Higashi-Ikebukuro Central Place (private areas)
Renewable energy
Renewable energy generation
The amount of renewable energy generation at TLR’s portfolio properties is as follows
This table can be scrolled sideways.
| FY2019 | FY2020 | FY2021 | FY2022 | FY2023 | |
|---|---|---|---|---|---|
| Solar power generation (kWh) | 312,713 | 371,566 | 350,752 | 367,121 | 348,327 |
*All electricity generated is sold to Shikoku Electric Power Company, Incorporated
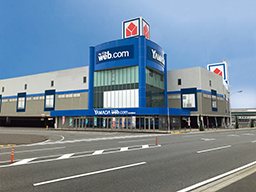
C-05 YAMADA web.com Matsuyama Toiyacho (Rooftop Solar Panel)
Status of initiatives to introduce renewable energy
The MIRARTH HOLDINGS Group, TLR’s main sponsor, engages in energy business utilizing renewable energy that contributes to reductions in the emissions of CO₂, a greenhouse gas, and is involved in the development and operation of biomass and wind power as well as solar power facilities.
At the time of this report's publication, various studies are underway regarding the introduction of renewable energy to properties owned by TLR.
Reduction of Greenhouse Gas Emissions
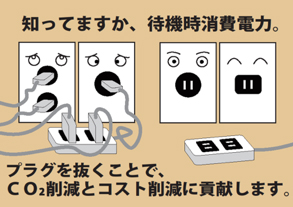
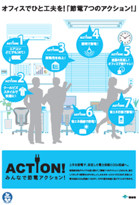
We are striving to create a shared power-saving culture through measures such as putting up awareness posters in common areas and tenants' private areas.
(Putting up power-saving awareness posters)

Reducing Water Consumption
At one of the properties in the portfolio, NT Building, rainwater is reused as flushing water in the bathrooms. Furthermore, we are striving to promote the conservation of water resources on an ongoing basis, such as completing work to install water-saving packing at 7 of the portfolio properties and pursuing awareness activities aimed at tenants.
(Displaying water-conservation posters)

Waste Reduction
As an initiative to reduce waste in office buildings, we are pursuing awareness activities aimed at tenants in collaboration with property and building managers.
(Displaying awareness posters)